Introduction
Table of Contents
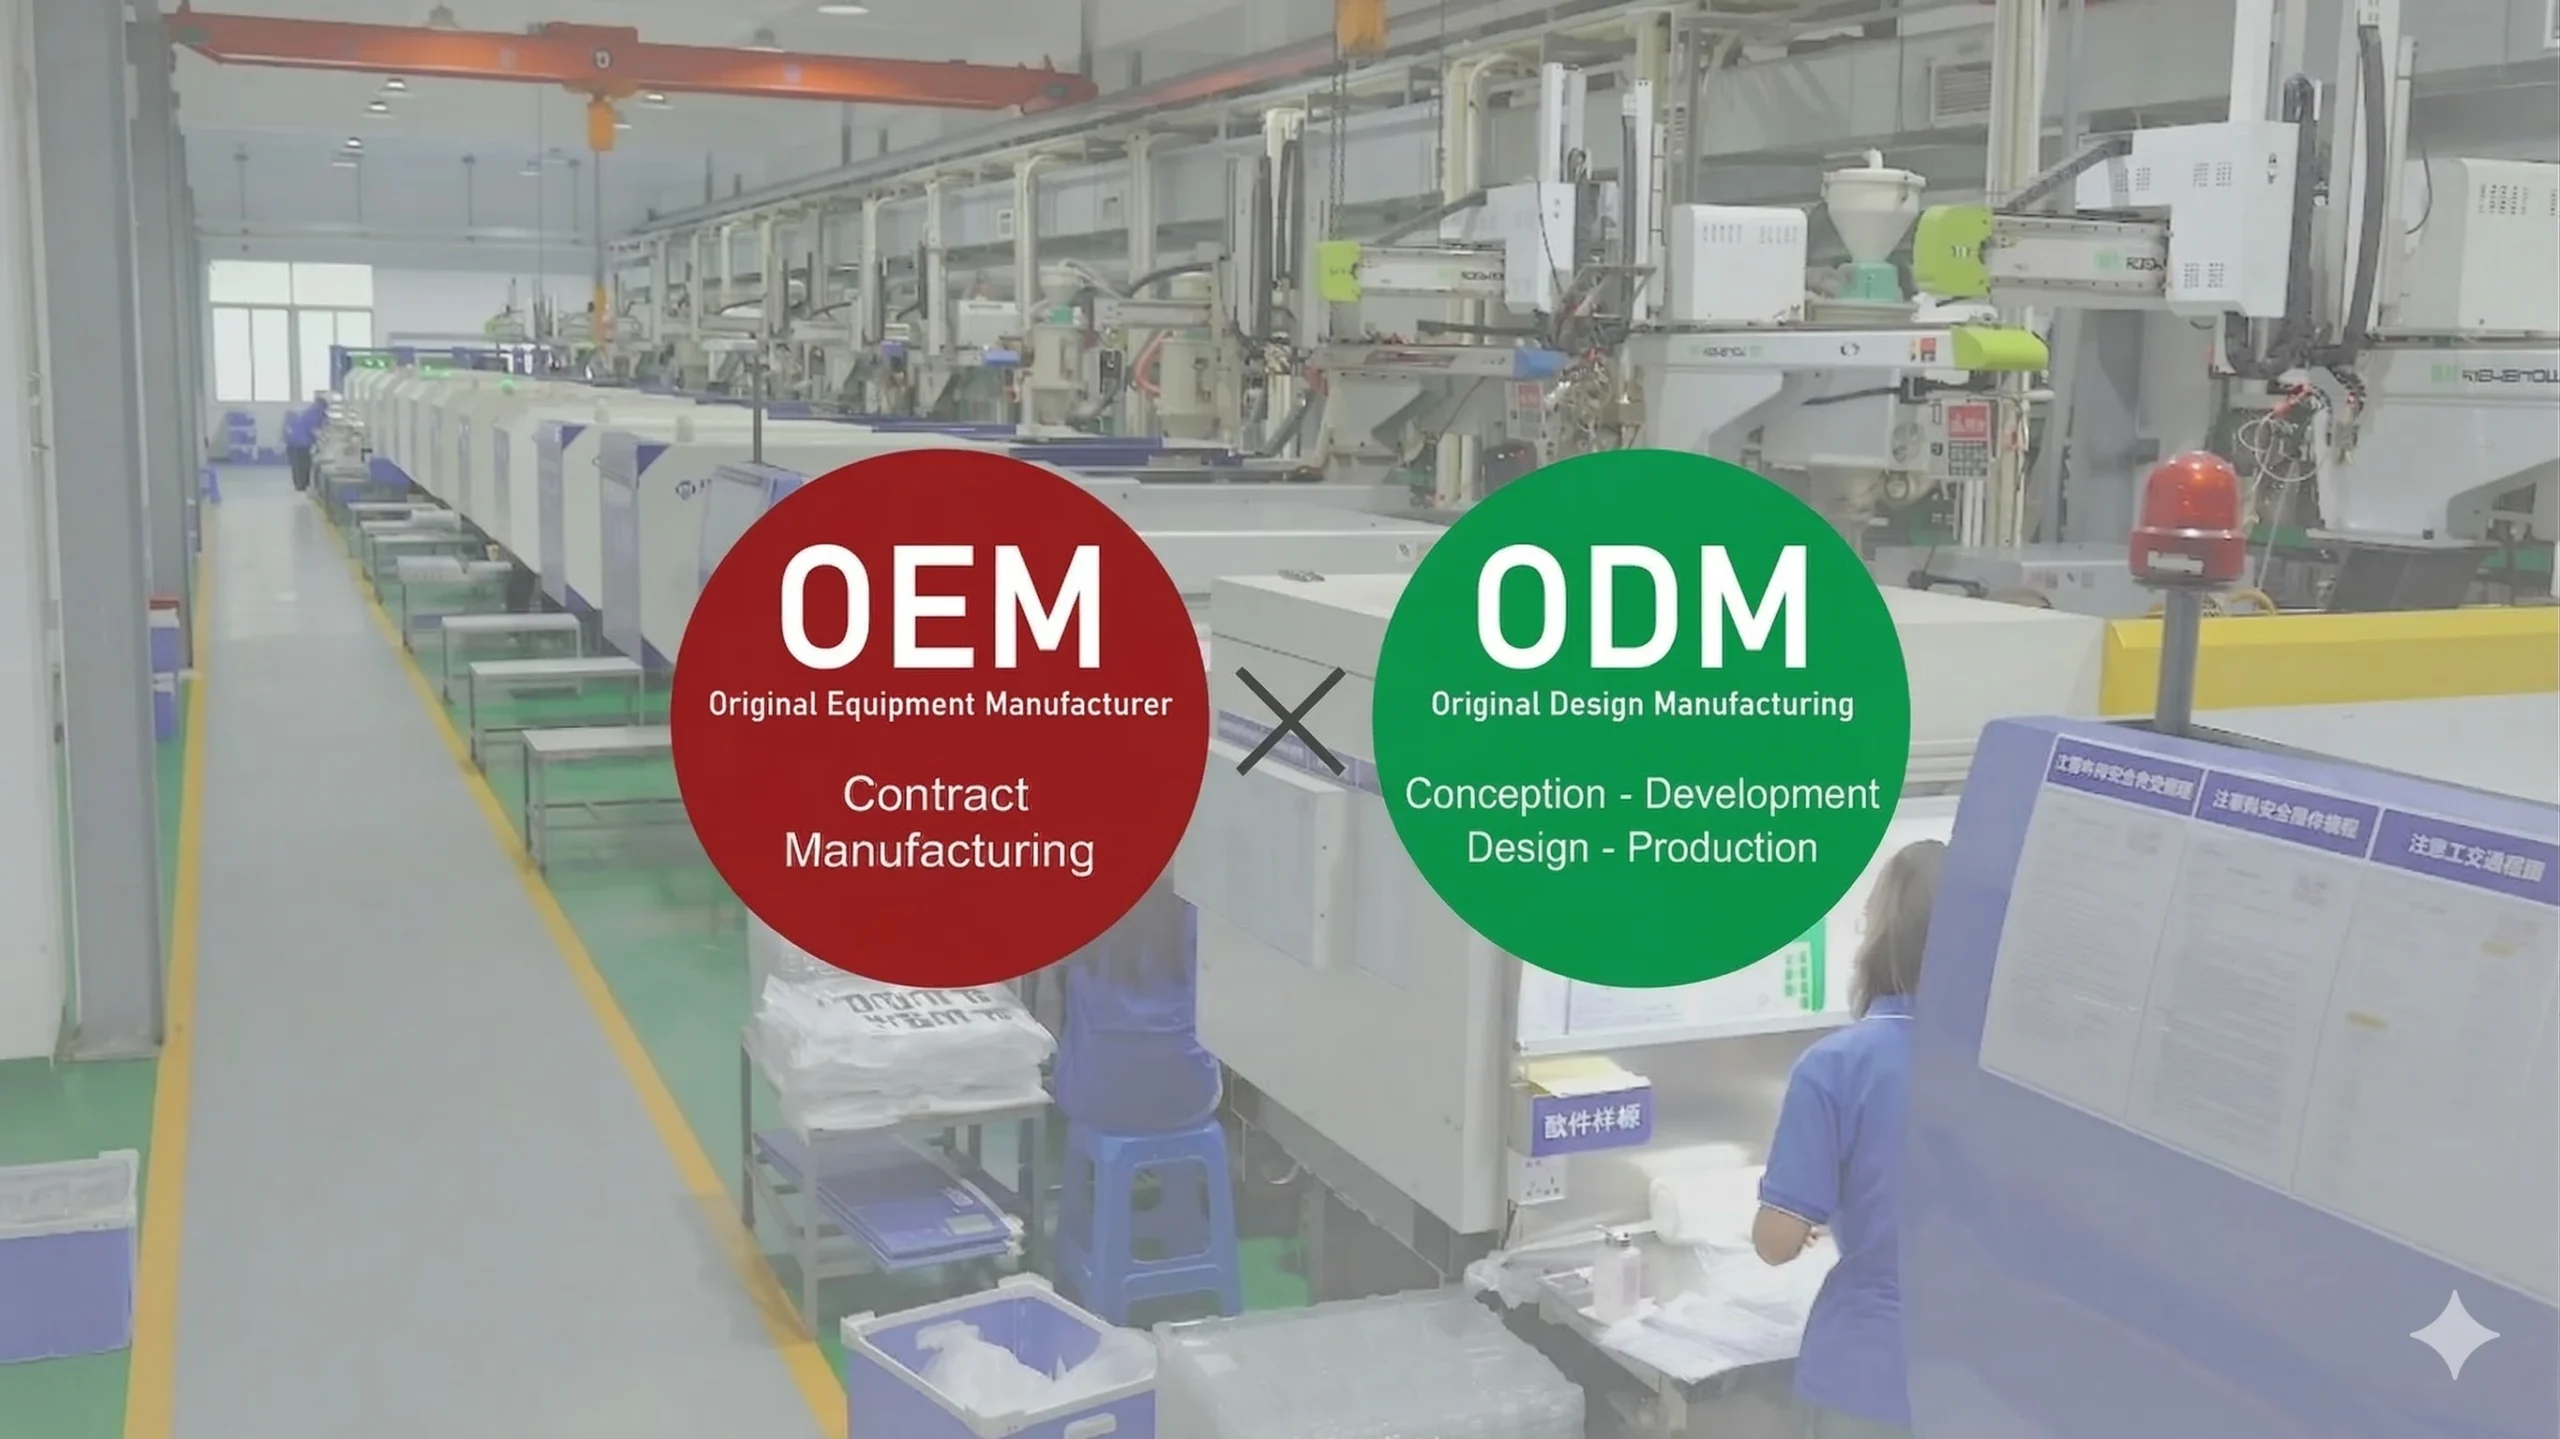
ToggleIn the competitive mobile accessories market, 68% of procurement teams report margin erosion due to unmanaged custom case costs (ABI Research 2023). While the sticker price per unit often dominates negotiations, true cost control requires a systems-level approach. This guide examines seven levers to reduce expenses without compromising quality, drawing on cross-industry best practices and manufacturing engineering principles.
1. Design Phase: Where 74% of Costs Are Locked In
1.1 The DFM Advantage
A MIT Sloan study found that Design for Manufacturing (DFM) optimizations reduce total costs by 18-34% across electronics accessories. Key considerations:
- Tolerance rationalization: Relaxing non-critical dimensions from ±0.05mm to ±0.1mm decreases machining time by 40%
- Texture simplification: Eliminating sub-0.2mm micro-patterns reduces mold polishing costs by $320-$650
- Standardized interfaces: Adopting MagSafe-compatible dimensions (IEC 62368-1) avoids $1.2k-$1.8k in redesign fees
Case Example: A Nordic consumer electronics brand achieved 22% cost reduction by:
- Standardizing charging port cutouts across 12 models
- Using parametric CAD templates for derivative designs
2. Material Selection: Beyond Price Per Kilogram
2.1 Total Cost of Ownership Analysis
| Material | Upfront Cost | Tool Wear Rate | Post-Processing | Defect Rate |
|---|---|---|---|---|
| Virgin PC | $3.20/kg | 1.8% per 10k shots | $0.12/unit | 1.1% |
| 30% GF PC | $3.80/kg | 0.9% per 10k shots | $0.07/unit | 0.4% |
Data source: UL Prospector Materials Database
The glass-filled (GF) option shows 17% lower lifecycle costs despite higher initial price.
2.2 Regulatory Preparedness
With 94% of EU buyers requiring full REACH/SVHC documentation (ECHA 2024):
- Pre-certified material libraries reduce compliance testing costs by $2.7k-$4.5k per SKU
- Dual-source material approval prevents 23% of supply disruptions (McKinsey)
3. Tooling Strategy: Precision vs Flexibility
3.1 Mold Lifecycle Cost Model
Variables:
- Initial tooling: $1,200-$8,500
- Maintenance: $0.003-$0.008 per shot
- Productivity loss from downtime: $18-$42/hour
Optimization Tactics:
- Modular mold bases: 55% faster insert changes for design variants
- Predictive maintenance: IoT-enabled wear sensors reduce unplanned downtime by 67%
- Multi-cavity balancing: 8-cavity molds with <2% weight variation increase yield by 14%
Technical Note: DIN 16742 standards recommend maximum 0.02mm parting line mismatch for Class 101 molds.
4. Supply Chain Orchestration
4.1 Logistics Optimization
- EU Strategy: Utilize bonded warehouses (e.g., Rotterdam) to defer 21% VAT until sale
- US Strategy: Combine LTL shipments with regional fulfillment centers (38% lower last-mile costs)
- Emergency Protocol: Maintain 5-7% buffer stock at strategic hubs for <72hr emergency replenishment
5. Quality Economics
5.1 The Hidden Multiplier Effect
A single defective unit can generate:
- $8.70 in return processing (Reverse Logistics Association)
- $150+ in potential brand damage (J.D. Power)
Preventive Measures:
- Statistical process control (SPC) at 23 checkpoints reduces escapes by 89%
- Automated optical inspection (AOI) with 10μm resolution detects 99.3% of cosmetic flaws
6. Partnership Models
6.1 Collaborative Cost Reduction Framework
Phase 1: Joint Value Analysis Workshop
- Map 136-point cost drivers using VA/VE methodologies
Phase 2: Risk/Reward Sharing Agreement
- Example: Split savings 50/50 from material substitution initiatives
Phase 3: Open Book Cost Monitoring
- Shared dashboards track 18 KPIs from energy use to PPM defect rates
7. Continuous Improvement
7.1 Cost Benchmarking Protocol
- Quarterly material index review (Plastics News pricing)
- Bi-annual tooling audit per NADCA standards
- Annual TCO reassessment with cross-functional team
Conclusion
Sustainable cost reduction requires aligning design intent with manufacturing reality while maintaining rigorous quality standards. By adopting these engineering-led strategies, procurement teams can deliver 19-28% cost improvements – equivalent to $142k annual savings per $1M spend – without resorting to risky corner-cutting.